
The ESG for Investors platform’s engagement maximiser leverages academic research to identify ‘ESG upside’ - potential share price improvements from companies bringing environmental, social and governance performance in line with top-rated peers. In previous posts, we have looked at some of the implications for companies in different sectors. In what follows, we consider the issue from the perspective of company size.
Depending on their market capitalisation, we have grouped the over 2000 public companies in our database into small cap, mid-cap, and large cap[1]. Several results of the analysis stand out.
The Golden Middle
Mid-caps can unlock the most value by improving ESG performance – cumulatively, this can add up to 25% of share price, on average.
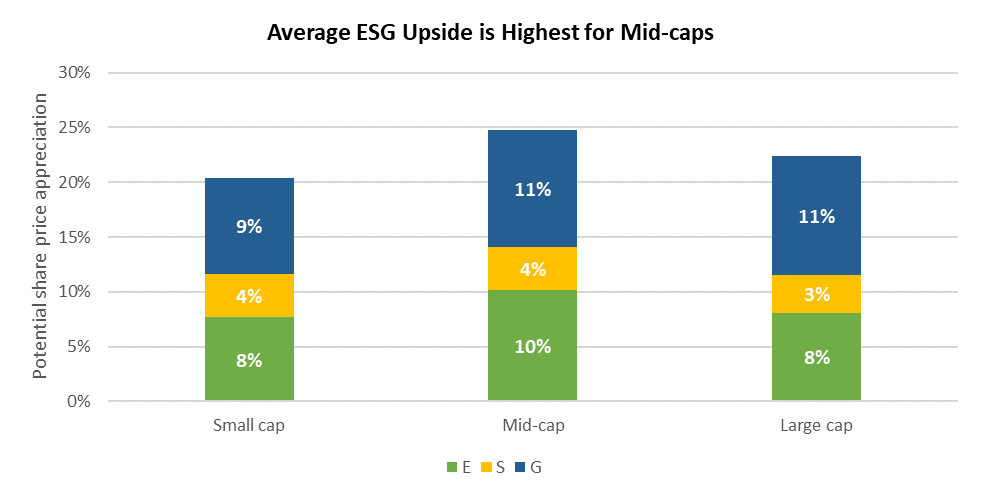
Source: ESG for Investors, as at March 2022
That might seem easier said than done. Indeed, one common challenge well-known to company secretaries (which we discussed in a recent webinar) is that larger companies have comparably more resources to devote to improved ESG reporting. Smaller companies may struggle to meet the requirements of an ‘alphabet soup’ of reporting frameworks (CDP, IR, GRI, TCFD, SASB, to name just a few), and may thus have lower ESG scores from third-party providers simply as a result of comparatively poor disclosure, rather than performance.
It is thus worth clarifying that this analysis does not rely on aggregate ESG scores – but is built bottom-up from individual, quantifiable metrics – such as the length of companies’ board tenure, or the level of their emissions. Looking at the individual indicators in more detail, mid-cap companies can unlock more value than large caps on most environmental and social metrics (CO2, water, waste, promotion of women and board diversity).
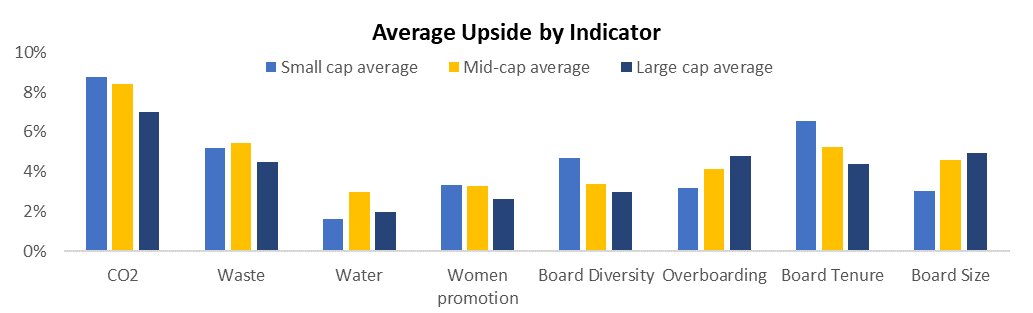
Source: ESG for Investors, as at March 2022
Going from averages to the top, mid-caps also dominate the rankings of the 30 companies with the highest potential upside. We illustrate below the number of small, mid-, and large cap companies (left-to-right) in the top 30. For simplicity, we have aggregated the 8 individual metrics into E, S, G and overall ESG upside.
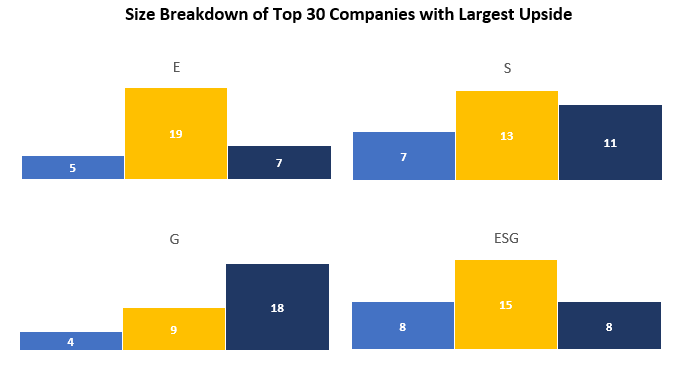
Source: ESG for Investors, as at March 2022.
Governance and growth
The notable exception, of course, is around governance. As shown above, the analysis suggests that improving the functionality of boards in terms of tenure, size, and time commitment (aka ‘overboarding’) can yield higher benefits for the largest companies. Whilst further research would be needed to establish causality, we offer several hypotheses that could explain this result:
- Fewer ‘low-hanging fruit’: Improvements in the carbon footprint or water efficiency of a major multinational company may be more costly than for a smaller company with a more localised supply chain, for example.
- The role of intangibles: Some research suggests that ‘intangible assets’ (such as brand value) are playing a growing role in company valuations. This in turn raises the value of the governance structures that can help protect and grow that intangible value. Put differently, the larger the company, the more costly a governance failure can be for investors.
In sum, mid-cap companies can practice their ‘Midas touch’, turning improvements in ESG performance into share price appreciation! Log onto the Engagement Maximiser to find out more about the dynamics of specific companies, regions, and sectors.
[1]Mid-caps are defined as having a market capitalisation between USD 5.6-17.5 bn (as at November 2021). Companies below/above that range are defined as small/large cap, respectively. For companies in emerging markets, the upper and lower thresholds were reduced by 50%, reflecting lower average company sizes.